The figure given below depicts long run equilibrium in an aggregate demand-aggregate supply model.The change in real GDP in this figure from Y1 to Y2 could have been caused by: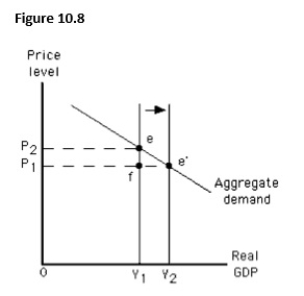
A) a government policy aimed at increasing demand.
B) a change in weather conditions that led to worldwide crop failures.
C) an attempt by key resource producers to monopolize supply.
D) an increase in taxation or a decrease in government spending.
E) an increase in labor productivity.
Correct Answer:
Verified
Q104: The figure given below depicts long run
Q105: Which of the following supply shocks will
Q106: Which of the following changes best represents
Q107: Which of the following is most likely
Q108: Which of these is most likely to
Q110: Suppose an economy is initially in long-run
Q111: Given the aggregate demand curve,an increase in
Q112: An economy's potential level of output can
Q113: The main effect of an increase in
Q114: The capital stock of an economy increases:
A)whenever
Unlock this Answer For Free Now!
View this answer and more for free by performing one of the following actions

Scan the QR code to install the App and get 2 free unlocks

Unlock quizzes for free by uploading documents