(Figure: Three Aggregate Demand Curves)
Figure: Three Aggregate Demand Curves 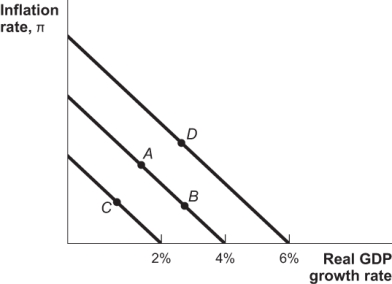
Consider the three aggregate demand curves shown in the graph. Movement from Point A to Point D represents:
A) an increase in spending growth from 2% to 3%.
B) an increase in spending growth from 4% to 6%.
C) an increase in real GDP growth, but not spending growth.
D) an increase in inflation, but not spending growth.
Correct Answer:
Verified
Q24: The aggregate demand curve shows all the
Q28: Which of the following combinations would be
Q29: All the combinations of inflation and real
Q31: The aggregate demand curve shows the relationship
Q32: If the growth rate of the money
Q34: If the growth rate of spending increases
Q35: The aggregate demand curve is:
A) upward sloping.
B)
Q36: If both the growth rate and the
Q37: Which of the following would cause the
Q38: Holding everything else constant,an increase in the
Unlock this Answer For Free Now!
View this answer and more for free by performing one of the following actions

Scan the QR code to install the App and get 2 free unlocks

Unlock quizzes for free by uploading documents