Exhibit 2-11 Production possibilities curves 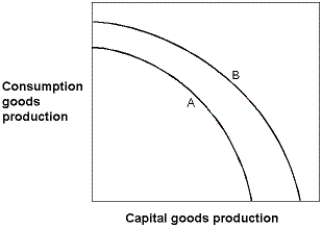
-In Exhibit 2-11, which of the following could have caused the production possibilities curve to shift from the one labeled B to the one labeled A?
A) A major natural disaster.
B) An increase in resources.
C) An advance in technology.
D) A decrease in unemployment.
E) An improvement in literacy.
Correct Answer:
Verified
Q104: Exhibit 2-13 Production possibilities curve 
Q105: Exhibit 2-7 Production possibilities curve
Q106: Exhibit 2-8 Production possibilities curve data
Q107: Exhibit 2-6 Production possibilities curve data
Q108: Exhibit 2-10 Production possibilities curve data
Q110: Exhibit 2-9 Production possibilities curve
Q111: Exhibit 2-13 Production possibilities curve
Q112: Exhibit 2-7 Production possibilities curve
Q113: Exhibit 2-12 Production possibilities curve
Q114: Exhibit 2-11 Production possibilities curves
Unlock this Answer For Free Now!
View this answer and more for free by performing one of the following actions

Scan the QR code to install the App and get 2 free unlocks

Unlock quizzes for free by uploading documents