Exhibit 2-19 Production possibilities curves 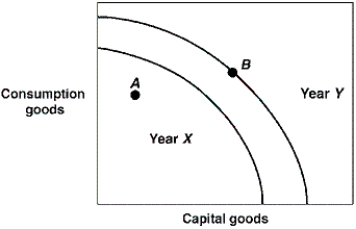
-In Exhibit 2-19, the production possibilities curves for a country are shown for the years Year X and Year Y. Which of the following could have caused a shift for Year X to Year Y in production possibilities curves?
A) An increase in unemployment.
B) A decline in technology.
C) An increase in the stock of capital goods.
D) A natural disaster.
E) More efficient production.
Correct Answer:
Verified
Q100: On a production possibilities curve diagram, greater
Q102: In economics, investment refers to the process
Q143: Which of the following is true?
A) The
Q145: With time, which one of the following
Q158: A major technological advance would be represented
Q160: Technological innovations will cause:
A) the production possibilities
Q164: What to produce, how to produce, and
Q165: Opportunity cost is the best alternative sacrificed
Q166: The opportunity cost of producing a good
Q168: Exhibit 2-17 Production possibilities curve 
Unlock this Answer For Free Now!
View this answer and more for free by performing one of the following actions

Scan the QR code to install the App and get 2 free unlocks

Unlock quizzes for free by uploading documents