Use the following to answer questions 5-6:
Figure 5.3 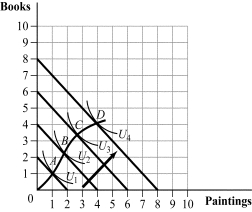
-(Figure 5.3) The curve that goes through the points A, B, C, and D is called the:
A) income elasticity curve.
B) optimal consumption path.
C) Engel curve.
D) income expansion path.
Correct Answer:
Verified
Q11: In 2010, the average household spent $1,178
Q15: Ryan's Engel curve for potato chips is
Q16: Use the following to answer question:
Figure 5.7
Q17: Use the following to answer question:
Figure 5.9
Q18: Use the following to answer question:
Figure 5.2
Q21: Use the following to answer questions 24-25:
Figure
Q22: Use the following to answer questions 36-37:
Figure
Q24: Use the following to answer questions 26-28:
Figure
Q25: Use the following to answer question:
Figure 5.17
Q38: What is the substitution effect of a
Unlock this Answer For Free Now!
View this answer and more for free by performing one of the following actions

Scan the QR code to install the App and get 2 free unlocks

Unlock quizzes for free by uploading documents