Use the following to answer question:
Figure 5.5 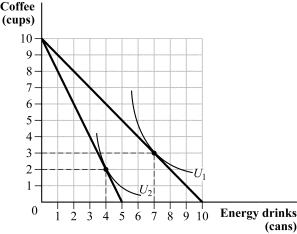
-(Figure 5.5) Suppose the consumer has $10 to spend on energy drinks and coffee. Which of the following figures represents the consumer's demand curve for energy drinks? 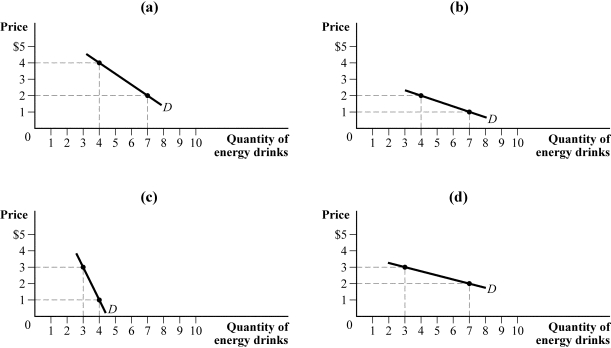
A) panel (a)
B) panel (b)
C) panel (c)
D) panel (d)
Correct Answer:
Verified
Q1: Use the following to answer question:
Figure 5.1
Q3: Use the following to answer questions 5-6:
Figure
Q5: The income effect of a price change
Q6: Suppose that Seth's income increases from $400
Q7: Use the following to answer question:
Figure 5.12
Q9: Use the following to answer question:
Figure 5.10
Q10: Use the following to answer question:
Figure 5.6
Q11: Use the following to answer question:
Figure 5.4
Q77: Julie spends all of her income on
Q89: When Logan earned $1,000 per week, he
Unlock this Answer For Free Now!
View this answer and more for free by performing one of the following actions

Scan the QR code to install the App and get 2 free unlocks

Unlock quizzes for free by uploading documents