Use the following to answer question:
Figure 3.5 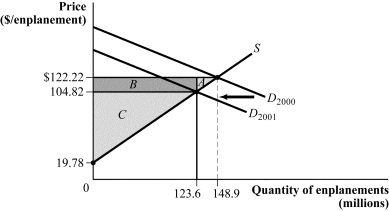
-(Figure 3.5) After September 11, the demand curve for air travel shifted inward, from D2000 to D2001. In 2000 the equilibrium price and quantity were $122.22 and 148.9 million enplanements, respectively. After September 11, the equilibrium price and quantity fell to $104.82 and 123.6 million enplanements, respectively. The loss in producer surplus attributable to the decrease in demand is equal to area:
A) A.
B) A + B.
C) B + C.
D) B.
Correct Answer:
Verified
Q5: Use the following to answer question:
Figure 3.6
Q6: Use the following to answer question:
Figure 3.3
Q8: The demand and supply curves for Fuji
Q11: When demand and supply are linear, consumer
Q12: The demand for a good is given
Q12: All else equal, a demand increase:
A) causes
Q13: Use the following to answer questions 11-12:
Figure
Q14: The market for organic cabbage is represented
Q15: Use the following to answer question:
Figure 3.1
Q51: Which of the following supply curves (where
Unlock this Answer For Free Now!
View this answer and more for free by performing one of the following actions

Scan the QR code to install the App and get 2 free unlocks

Unlock quizzes for free by uploading documents