Figure-2 depicts the: 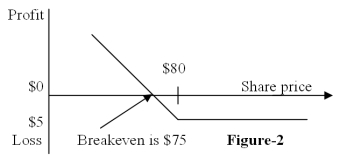
A) position diagram for the buyer of a call option
B) profit diagram for the buyer of a call option
C) position diagram for the buyer of a put option
D) profit diagram for the buyer of a put option
Correct Answer:
Verified
Q15: The two principal options exchanges in the
Q16: Figure-3 depicts the: Q17: In June 2007, an investor buys a Q18: The buyer of a call option has Q19: The writer (seller) of a regular exchange-listed Q21: If the volatility of the underlying asset Q22: The higher the underlying stock price: (everything Q24: If the risk-free interest rate increases: Q25: Given the following data: Expiration = 6 Q40: Suppose an investor buys one share of![]()
A) the
Unlock this Answer For Free Now!
View this answer and more for free by performing one of the following actions

Scan the QR code to install the App and get 2 free unlocks

Unlock quizzes for free by uploading documents