The diagram below shows a pharmaceutical firm's demand curve and marginal cost curve for a new heart medication for which the firm holds a 20-year patent on its production. 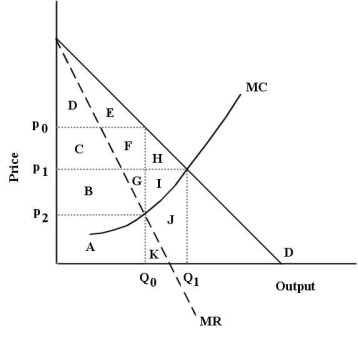 FIGURE 10-5
-Refer to Figure 10-5. Assume this pharmaceutical firm has no fixed costs and is practicing perfect price discrimination among its buyers. At its profit-maximizing level of output, it will generate a total profit represented by
A) areas C+F+H.
B) areas B+C+F+G+H+I.
C) the area below the demand curve minus the area below the MC curve, up to Q₁.
D) areas G+I.
E) - it is not possible to determine with the information provided.
Correct Answer:
Verified
Q76: Consider the following AR and MR curves
Q77: Consider the following AR and MR curves
Q82: A monopolist will be earning positive economic
Q88: The average revenue curve for a single-
Q89: Consider a monopolist that is able to
Q90: Consider a monopolist that is able to
Q92: A single- price monopolist is currently producing
Q96: The diagram below shows a pharmaceutical firm's
Q99: The marginal revenue curve facing a single-
Q109: A monopolist faces a straight- line demand
Unlock this Answer For Free Now!
View this answer and more for free by performing one of the following actions

Scan the QR code to install the App and get 2 free unlocks

Unlock quizzes for free by uploading documents