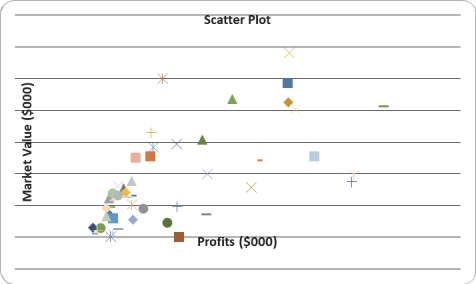
Given below is the scatter plot of the market value (thousands$)and profit (thousands$)of 50 U.S.companies.There appears to be a negative relationship between market value and profit.
Correct Answer:
Verified
Q170: SCENARIO 2-18
The stem-and-leaf display below shows the
Q171: SCENARIO 2-18
The stem-and-leaf display below shows the
Q172: Given below is the scatter plot of
Q173: The addition of visual elements that either
Q174: SCENARIO 2-18
The stem-and-leaf display below shows the
Q176: SCENARIO 2-18
The stem-and-leaf display below shows the
Q177: Given below is the scatter plot of
Q178: SCENARIO 2-18
The stem-and-leaf display below shows the
Q179: The Guidelines for Developing Visualizations recommend labeling
Q180: The Guidelines for Developing Visualizations recommend using
Unlock this Answer For Free Now!
View this answer and more for free by performing one of the following actions

Scan the QR code to install the App and get 2 free unlocks

Unlock quizzes for free by uploading documents