The figure given below shows the national market for mopeds in a country. Dd and Sd are the domestic demand and supply curves of mopeds respectively. 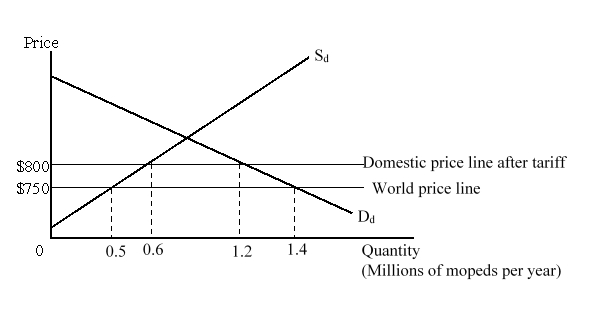 The figure given below shows the marginal external benefit curve (MEB) of the country from the production of domestic mopeds.
 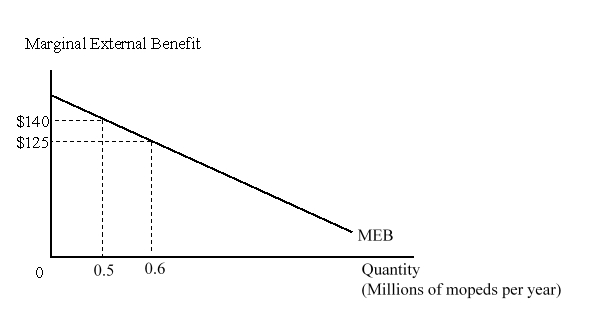 The overall impact of the tariff on the nation would be:
A) a loss of $15 million.
B) a loss of $20.75 million.
C) a gain of $13.25 million.
D) a gain of $5.75 million.
Correct Answer:
Verified
Q20: If Social Marginal Cost (SMC) > Price
Q21: Which of the following asserts that temporary
Q22: Which of the following asserts that import-competing
Q23: The figure given below shows the national
Q24: The figure given below shows the national
Q26: The figure given below shows the national
Q27: The import tariff rates are typically higher
Q28: Under which of the following situations will
Q29: Whenever the benefits of group effort fall
Q30: According to the developing government argument, tariffs
Unlock this Answer For Free Now!
View this answer and more for free by performing one of the following actions

Scan the QR code to install the App and get 2 free unlocks

Unlock quizzes for free by uploading documents