The numbers of hours worked (per week) by 400 statistics students are shown below. 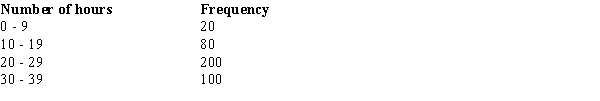 The midpoint of the third class is
A) 25.5
B) 24.
C) 25.
D) 24.5.
Correct Answer:
Verified
Q16: A cumulative relative frequency distribution shows
A) the
Q17: The total number of data items with
Q18: The relative frequency of a class is
Q19: Data that provide labels or names for
Q20: A cumulative frequency distribution is
A) a tabular
Q22: The frequency distribution below was constructed from
Q23: A sample of fifteen 7-year old boys
Q24: A survey of 800 college seniors resulted
Q25: A sample of fifteen 7-year old boys
Q26: The numbers of hours worked (per week)
Unlock this Answer For Free Now!
View this answer and more for free by performing one of the following actions

Scan the QR code to install the App and get 2 free unlocks

Unlock quizzes for free by uploading documents