A student conducted a survey among different groups of people in his town in which he asked how many times per year they visit the theater. 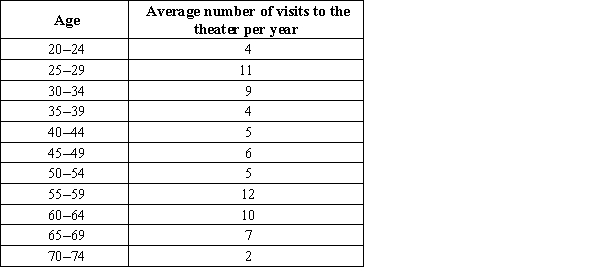 The accompanying table provides data on the age and average number of visits to the theater per year. Construct a scatterplot of x = age and y = number of visits to the theater per year. Does age appear to be related to the average number of visits to the theater per year?
A) There appears to be no tendency for the number of visits to the theater to increase or decrease as age increases.
B) There appears to be a strong tendency for the number of visits to the theater to increase as age increases.
C) There appears to be a strong tendency for the number of visits to the theater to decrease as age increases.
Correct Answer:
Verified
Q15: The quantity Q16: In a scatter plot, both the horizontal Q17: For stem and leaf plots with single-digit Q18: A curve with tails that decline more Q19: Exhibit 3-4 There has been a recent Q20: The density of a class can be Q21: Consider the time series plot. Determine what Q22: Each year Anna conducts a poll among Q24: As part of the United States Census, Q25: Exhibit 3-5 In birds, the muscles that![]()
Unlock this Answer For Free Now!
View this answer and more for free by performing one of the following actions

Scan the QR code to install the App and get 2 free unlocks

Unlock quizzes for free by uploading documents