Multiple Choice
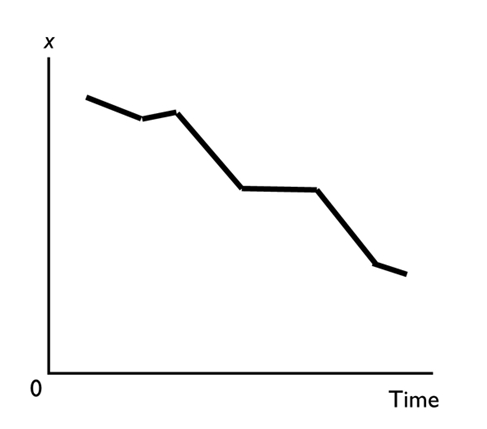
In the above figure, the diagram shows
A) a two-variable scatter diagram.
B) a scatter diagram.
C) a cross-section graph between x and time.
D) a downward trend in x.
E) an upward trend in x.
Correct Answer:
Verified
Related Questions
Q8: A scatter diagram can be used to
Q9: Of the three major economic questions, which
Q10: The value of the best thing that
Unlock this Answer For Free Now!
View this answer and more for free by performing one of the following actions

Scan the QR code to install the App and get 2 free unlocks

Unlock quizzes for free by uploading documents