Exhibit 28-2
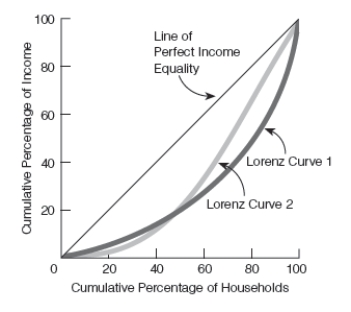
-A graph showing the relationship between the ____________________ and the ________________________ is called the ______________ curve.
A) cumulative percentage of households; cumulative percentage of income; Lorenz
B) cumulative percentage of households; cumulative percentage of income; Gini
C) cumulative percentage of households; cumulative percentage of income; Laffer
D) percentage of households living in poverty; percentage of households living above the poverty line; Lorenz
E) none of the above
Correct Answer:
Verified
Q86: Exhibit 28-4 Q87: Exhibit 28-4 Q88: Describe the relationship between income and education Q89: Smith and Jones are different when it Unlock this Answer For Free Now! View this answer and more for free by performing one of the following actions Scan the QR code to install the App and get 2 free unlocks Unlock quizzes for free by uploading documents
![]()
![]()

