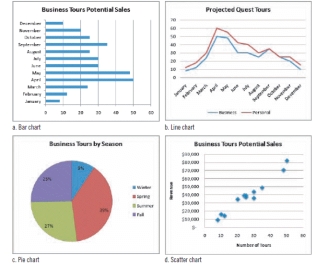
-Referring to the bar chart in the figure above, a bar chart uses rectangular bars to display data values.The statement below that is true is: ____.
A) A longer bar means a greater value
B) A smaller bar means a greater value
C) The size of the bar does not correspond to the value
D) None of the above
Correct Answer:
Verified
Q15: Survey designers recommend _ scales as the
Q16: Early DSSs were small, proprietary, and inexpensive.
Q17: To make numeric data useful, organize it
Q18: Q19: Decision variables are often used in formulas Q21: MODIFIED TRUE/FALSE Q22: MODIFIED TRUE/FALSE Q23: The first chart that Helen is putting Q24: Like OpenOffice Calc, _ is a free, Q25: MODIFIED TRUE/FALSE![]()
-Standard deviation is a measure of
-You can model your decisions quantitatively,
-When you solve a problem systematically,
Unlock this Answer For Free Now!
View this answer and more for free by performing one of the following actions

Scan the QR code to install the App and get 2 free unlocks

Unlock quizzes for free by uploading documents