The following figure contains the graphs of the cross sections z = f(a, y) for a = -2, -1, 0, 1, 2.Which of the graphs of z = f(x, y) in A and B best fits this information? 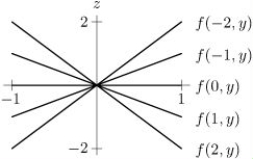
A) 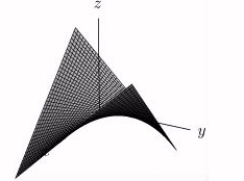
B) 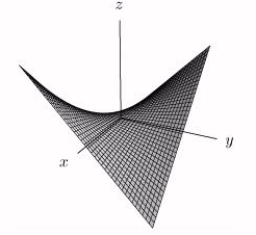
Correct Answer:
Verified
Q21: Match the function with the graph
Q22: The contours of the function f(x, y)=
Q23: Consider the function
Q24: The graph of the function f(x, y)is
Q25: The diagram below shows the contour map
Q27: Consider the function
Q28: Which of the following is a contour
Q29: Draw the level curves for z =
Q30: What is the slope of the
Q31: Draw a possible contour diagram for the
Unlock this Answer For Free Now!
View this answer and more for free by performing one of the following actions

Scan the QR code to install the App and get 2 free unlocks

Unlock quizzes for free by uploading documents