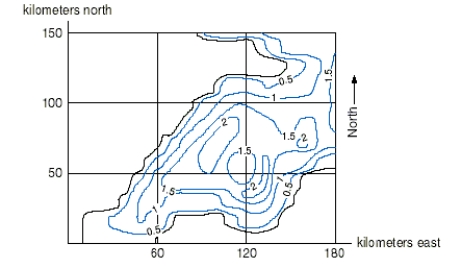
Below is a contour diagram depicting D, the average fox population density as a function of , kilometers east of the western end of England, and , kilometers north of the same point.  Is D increasing or decreasing at the point (120, 25)in the northern direction?
Correct Answer:
Verified
View Answer
Unlock this answer now
Get Access to more Verified Answers free of charge
Q54: Does the point (-5, -1, -5)lie
Q55: Determine the equation of the plane which
Q56: Describe the set of points whose distance
Q57: Find an equation for the plane passing
Q58: What is the domain of
Q60: If all of the contours of a
Unlock this Answer For Free Now!
View this answer and more for free by performing one of the following actions

Scan the QR code to install the App and get 2 free unlocks

Unlock quizzes for free by uploading documents