Refer to the graph shown.The shift in the graph from D1 to D2 is least likely to be caused by: 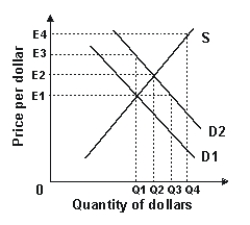
A) expansionary fiscal policy that raises U.S.interest rates.
B) expansionary fiscal policy that raises U.S.income.
C) contractionary fiscal policy that reduces U.S.prices.
D) contractionary fiscal policy that increases U.S.exports.
Correct Answer:
Verified
Q102: Refer to the graph shown.The shift in
Q103: Self-fulfilling expectations challenge the idea of a
Q104: Considering its effects through income, the price
Q105: Considering primary effects through the price level,
Q109: Refer to the graph shown.The shift in
Q110: The combination of expansionary U.S. monetary policy
Q110: Considering primary effects through the price level,
Q111: Which of the following would most likely
Q113: Expansionary fiscal policy tends to:
A)reduce both U.S.
Q115: If the government chooses not to buy
Unlock this Answer For Free Now!
View this answer and more for free by performing one of the following actions

Scan the QR code to install the App and get 2 free unlocks

Unlock quizzes for free by uploading documents