Refer to the following graph. 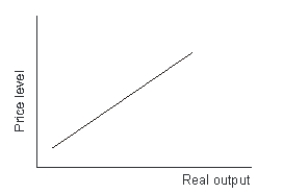 The upward sloping relationship in the diagram represents the:
A) aggregate demand curve.
B) short-run aggregate supply curve.
C) long-run aggregate supply curve.
D) quantity adjustment curve.
Correct Answer:
Verified
Q82: With an upward-sloping short-run aggregate supply curve,
Q86: If productivity increases by 2 percent but
Q89: If the multiplier is 4, a $15
Q89: The axes for the short-run aggregate supply
Q93: An increase in production costs is most
Q94: The short-run aggregate supply curve is upward
Q95: Federal Reserve policy makers argue about whether
Q95: In early 2000s, oil prices were rising
Q96: If a fall in the price level
Q113: The short-run aggregate supply curve is most
Unlock this Answer For Free Now!
View this answer and more for free by performing one of the following actions

Scan the QR code to install the App and get 2 free unlocks

Unlock quizzes for free by uploading documents