Refer to the graph shown.A movement from A to B is most likely to be caused by: 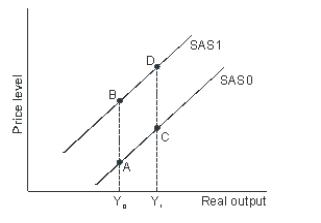
A) an increase in input prices.
B) a decrease in input prices.
C) an increase in aggregate demand.
D) a decrease in aggregate demand.
Correct Answer:
Verified
Q51: Which of the following would shift the
Q77: If the U.S. government increased taxes without
Q80: From 1975 to 1995, the value of
Q81: If workers begin to expect more inflation
Q88: During the late 1990s in the United
Q91: A sharp increase in oil prices along
Q92: According to the short-run aggregate supply curve,
Q97: If productivity increases by 5 percent but
Q115: If productivity increases by 3 percent but
Q120: In the early 2000s the European Central
Unlock this Answer For Free Now!
View this answer and more for free by performing one of the following actions

Scan the QR code to install the App and get 2 free unlocks

Unlock quizzes for free by uploading documents