Given this histogram, find the class which has the smallest frequency. (All frequencies graphed to nearest 5) 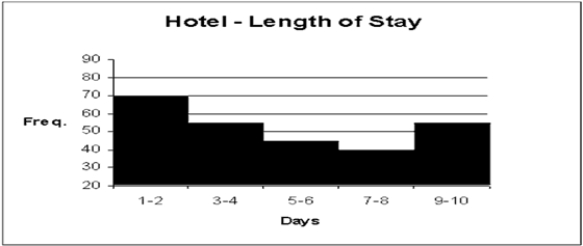
A) 5−6
B) 7−8
C) 1−2
D) 9−10
Correct Answer:
Verified
Q51: A component bar chart is used to
Q52: Calculate the mean of the grouped
Q53: Using 4 classes of width 150 starting
Q54: The mode is the value or values
Q55: Calculate the mean of the grouped
Q57: Calculate the mean of the grouped
Q58: A type of bar chart used to
Q59: The midpoint value of a set of
Q60: Find the range of the following numbers:
Q61: The table below shows students at
Unlock this Answer For Free Now!
View this answer and more for free by performing one of the following actions

Scan the QR code to install the App and get 2 free unlocks

Unlock quizzes for free by uploading documents