Exhibit 3-2
In 1990 the New York Times reported the average number of square feet per standing passenger in 1987 and 1988 for 19 subway stops. Although the sampling method was not reported, we will presume that these data represent a random sample of days during the morning and evening rush hours. The NYC Transit Authority managers attempted to improve the space problem on subway cars (more space is better--trust us!) by adding cars to trains during the rush hours. They gathered the 1988 data to check on their efforts after one year. The data are in the table below. 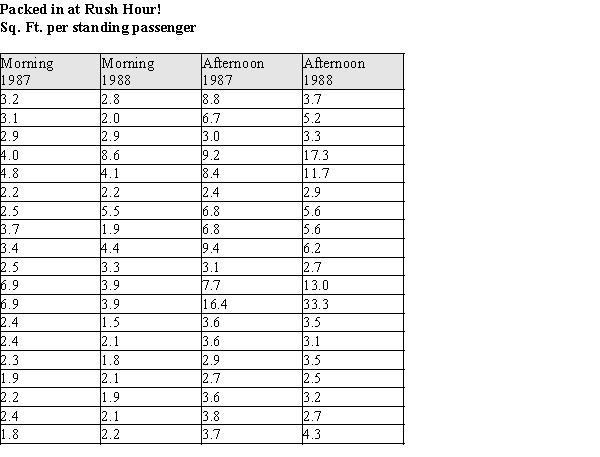
-Refer to Exhibit 3-2.
(a)Construct a comparative stem & leaf plot of the space per standing passenger for the morning rushes of 1987 vs. the morning rushes of 1988.
(b)Using your plot in part (a), describe the differences and similarities in the distributions of the morning standing room for the two years.
Correct Answer:
Verified
View Answer
Unlock this answer now
Get Access to more Verified Answers free of charge
Q2: The following nitrous oxide emissions (in thousands
Q4: The accompanying data are consistent with summary
Q7: The questions below refer to decisions made
Q8: Costs per serving (in cents) for 16
Q9: The variance is the positive square root
Q9: Exhibit 3-2
In 1990 the New York
Q10: The dot plot below shows the annual
Q10: The interquartile range is resistant to the
Q16: By definition, an outlier is "extreme" if
Q18: The mean is the middle value of
Unlock this Answer For Free Now!
View this answer and more for free by performing one of the following actions

Scan the QR code to install the App and get 2 free unlocks

Unlock quizzes for free by uploading documents