Multiple Choice
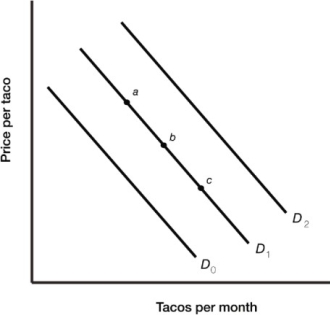 Figure 3.3
-Figure 3.3 illustrates the demand for tacos. A decrease in the demand for tacos is represented by the movement from
A) point a to point b.
B) point c to point b.
C) D2 to D1.
D) D0 to D1.
Correct Answer:
Verified
Related Questions
Q42: Governments sometime create an excess demand for
Q48: A government sometimes creates an excess supply
Unlock this Answer For Free Now!
View this answer and more for free by performing one of the following actions

Scan the QR code to install the App and get 2 free unlocks

Unlock quizzes for free by uploading documents