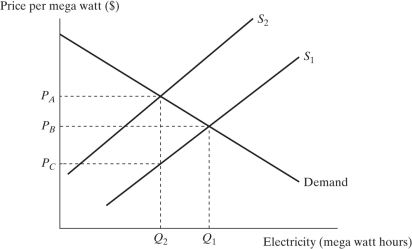
Solved

Figure 9.8 -Figure 9.8 Depicts a Market for Electricity. Assume Electricity Production

Question 296

Multiple Choice

  Figure 9.8 -Figure 9.8 depicts a market for electricity. Assume electricity production incurs external costs. If the government imposes a pollution tax $T per mega kilowatt, A) the supply curve will shift to the right. B) the supply curve will shift to the left. C) demand curve will shift to the right. D) demand curve will shift to the left. Figure 9.8
-Figure 9.8 depicts a market for electricity. Assume electricity production incurs external costs. If the government imposes a pollution tax $T per mega kilowatt,


A) the supply curve will shift to the right.
B) the supply curve will shift to the left.
C) demand curve will shift to the right.
D) demand curve will shift to the left.

Correct Answer:

verifed

Verified

Unlock this answer now
Get Access to more Verified Answers free of charge

Related Questions

Unlock this Answer For Free Now!

View this answer and more for free by performing one of the following actions

qr-code

Scan the QR code to install the App and get 2 free unlocks

upload documents

Unlock quizzes for free by uploading documents