Multiple Choice
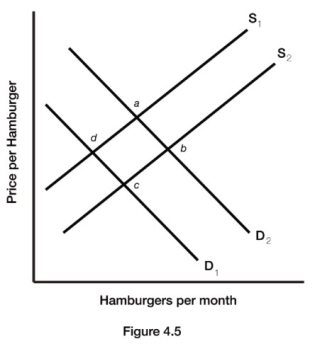
-Figure 4.5 illustrates a set of supply and demand curves for hamburgers. An increase in demand and an increase in quantity supplied are represented by a movement from
A) point b to point a.
B) point c to point d.
C) point d to point a.
D) point b to point d.
Correct Answer:
Verified
Related Questions
Q118: The price of iPhones has fallen dramatically.
Q119: Explain the difference between a change in
Q121: Q122: If producers have an expectation of higher Q124: Suppose that in October the price of Q125: If the demand for jelly decreases, and![]()
Unlock this Answer For Free Now!
View this answer and more for free by performing one of the following actions

Scan the QR code to install the App and get 2 free unlocks

Unlock quizzes for free by uploading documents