Figure 5-4
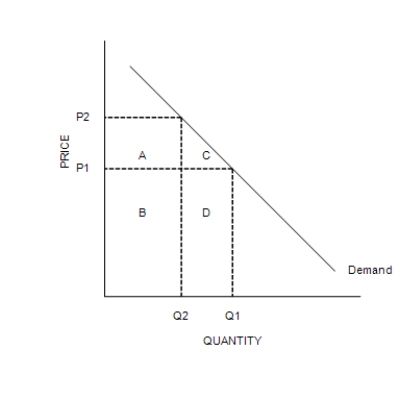
-Refer to Figure 5-4. Total revenue when the price is P1 is represented by
A) areas B + D.
B) areas A + B.
C) areas C + D.
D) area D.
Correct Answer:
Verified
Q174: Figure 5-3 Q175: Elasticity of demand is closely related to Q176: Demarcus says that he will spend exactly Q177: When small changes in price lead to Q178: You are in charge of the local Q180: Which of the following could be the Q181: When her income increased from $10,000 to Q182: For which of the following goods is Q183: Assume that a 4 percent increase in Q184: Suppose that two supply curves pass through
![]()
Unlock this Answer For Free Now!
View this answer and more for free by performing one of the following actions

Scan the QR code to install the App and get 2 free unlocks

Unlock quizzes for free by uploading documents