The following display from a graphing calculator presents the least-squares regression line for predicting the price of a certain commodity (y) from the price of a barrel of oil (x) .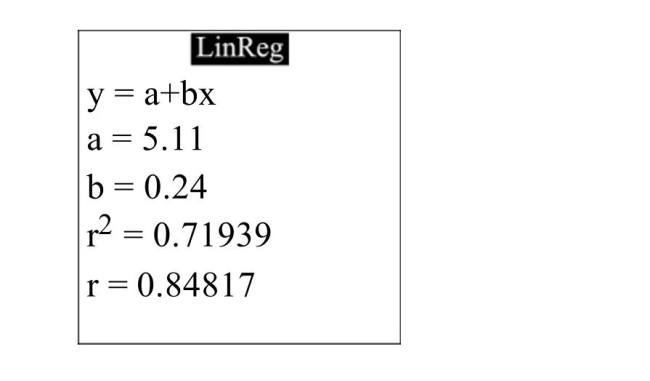 What is the correlation between the oil price and the commodity price?
A) 5.11
B) 0.24
C) 0.71939
D) 0.84817
Correct Answer:
Verified
Q12: One of the primary feeds for
Q13: The following table presents the number
Q14: The following table presents the number
Q15: The following display from a graphing
Q16: Compute the least-squares regression line for
Q18: The common cricket can be used
Q19: The common cricket can be used
Q20: One of the primary feeds for
Q21: An automotive engineer computed a least-squares
Q22: For the following data set, how
Unlock this Answer For Free Now!
View this answer and more for free by performing one of the following actions

Scan the QR code to install the App and get 2 free unlocks

Unlock quizzes for free by uploading documents