The following table shows the weekly total sales (in dollars) at a small roadside vegetable stand for the months June through September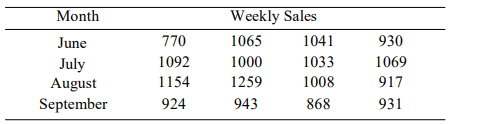
i). Construct an ANOVA table.
ii). Can you conclude that the weekly sales varies with the month? Use the Į = 0.05 level of significance.
Correct Answer:
Verified
View Answer
Unlock this answer now
Get Access to more Verified Answers free of charge
Q51: In a water-bottling facility, several machines
Q52: level Samples were drawn from three
Q53: In a water-bottling facility, several machines
Q54: An experiment is conducted to study the
Q55: The following table shows the weekly
Q57: An experiment is conducted to study
Q58: Interpret the interaction plot by explaining whether
Q59: In a water-bottling facility, several machines
Q60: Artificial hip joints consist of a
Q61: The summary statistics for a certain
Unlock this Answer For Free Now!
View this answer and more for free by performing one of the following actions

Scan the QR code to install the App and get 2 free unlocks

Unlock quizzes for free by uploading documents