The figure represents the results of a survey on favorite foods. 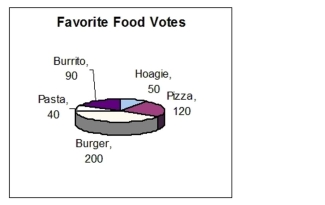 How many times more votes were there for pizza as for hoagies?
Correct Answer:
Verified
View Answer
Unlock this answer now
Get Access to more Verified Answers free of charge
Q6: Use a protractor to construct an angle
Q7: The sales tax on a bookcase is
Q8: How much larger is the Caspian Sea
Q9: Identify an appropriate ratio to convert ft
Q10: A company did a poll of how
Q12: For the English sentence below, write a
Q13: Convert the unit of capacity. 
Q14: Convert the units of length using unit
Q15: Multiply and write the answer as a
Q16: The figure represents the results of a
Unlock this Answer For Free Now!
View this answer and more for free by performing one of the following actions

Scan the QR code to install the App and get 2 free unlocks

Unlock quizzes for free by uploading documents