The following data represent the number of cars passing through a toll booth during a certain time period over a number of days.
Which of these choices display the correct dotplot?
A) Number of Cars Passing Througha Toll Booth 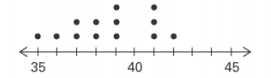
B) Number of Cars Passing Through a Toll Booth 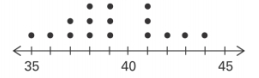
C) Number of Cars Passing Through a Toll Booth 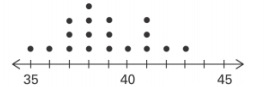
D) Number of Cars Passing Through a Toll Booth 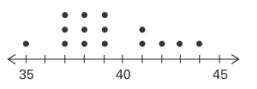
Correct Answer:
Verified
Q28: A manufacturer records the number of
Q29: A nurse measured the blood pressure of
Q30: Attendance records at a school show
Q31: The following data consists of the
Q33: The frequency distribution below summarizes the
Q34: Wagenlucht Ice Cream Company is always trying
Q35: The linear _ coefficient denoted by r
Q35: The histogram below represents the number of
Q36: The frequency distribution below summarizes the
Q37: The ages of the 45 members
Unlock this Answer For Free Now!
View this answer and more for free by performing one of the following actions

Scan the QR code to install the App and get 2 free unlocks

Unlock quizzes for free by uploading documents