The figure shows is a plot and a fitted linear regression line of the age-earnings profile of
1,744 individuals, taken from the Current Population Survey. 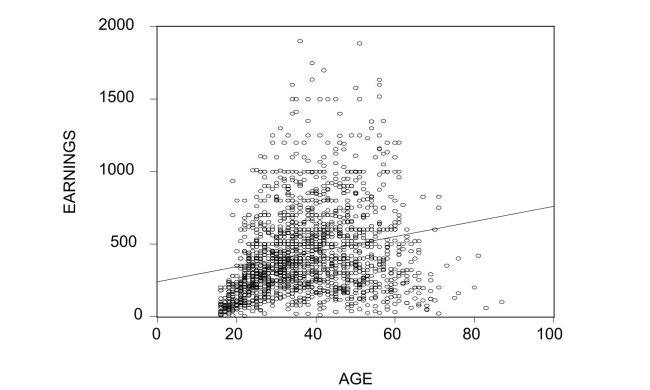 (a)Describe the problems in predicting earnings using the fitted line.What would the pattern
of the residuals look like for the age category under 40?
Correct Answer:
Verified
View Answer
Unlock this answer now
Get Access to more Verified Answers free of charge
Q32: Sports economics typically looks at winning
Q33: Females, it is said, make 70 cents
Q34: After analyzing the age-earnings profile for
Q35: In the regression model
Q36: Earnings functions attempt to find the
Q38: Indicate whether or not you can
Q39: An extension of the Solow growth
Q40: One of the most frequently estimated
Q41: Earnings functions attempt to predict the
Q49: To investigate whether or not there is
Unlock this Answer For Free Now!
View this answer and more for free by performing one of the following actions

Scan the QR code to install the App and get 2 free unlocks

Unlock quizzes for free by uploading documents