For each of the accompanying scatterplots for several pairs of variables, indicate
whether you expect a positive or negative correlation coefficient between the two
variables, and the likely magnitude of it (you can use a small range).
(a) 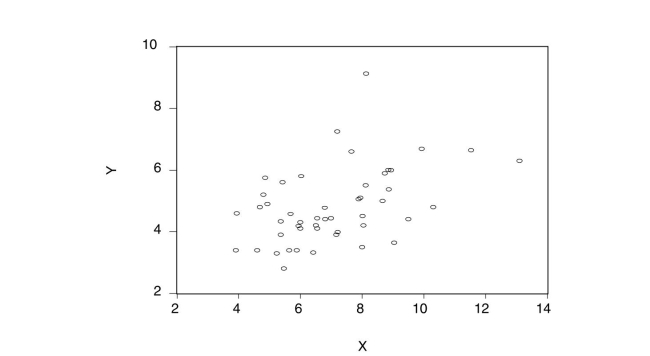
Correct Answer:
Verified
View Answer
Unlock this answer now
Get Access to more Verified Answers free of charge
Q25: Think of at least nine examples, three
Q27: A manufacturer claims that a certain brand
Q28: The standard error for the difference
Q29: Adult males are taller, on average, than
Q30: Your textbook defines the correlation coefficient
Q31: The following statement about the sample
Q33: When the sample size n
Q34: During the last few days before
Q35: Your textbook defined the covariance between
Q36: The power of the test a.
Unlock this Answer For Free Now!
View this answer and more for free by performing one of the following actions

Scan the QR code to install the App and get 2 free unlocks

Unlock quizzes for free by uploading documents