The following two graphs give you a plot of the United States aggregate unemployment
rate for the sample period 1962:I to 1999:IV, and the (log)level of real United States
GDP for the sample period 1962:I to 1995:IV.You want test for stationarity in both
cases.Indicate whether or not you should include a time trend in your Augmented
Dickey-Fuller test and why. United States Unemployment Rate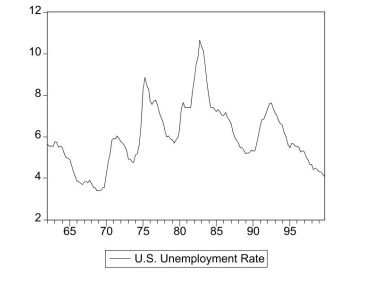
United States Real GDP (in logarithms)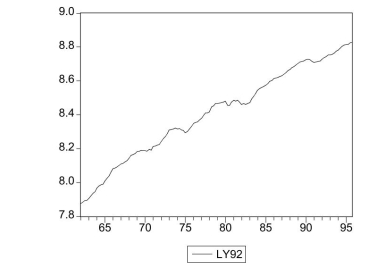
Correct Answer:
Verified
View Answer
Unlock this answer now
Get Access to more Verified Answers free of charge
Q5: Time series variables fail to be stationary
Q20: The AR(p) model
A) is defined as
Q21: Q23: (Requires Appendix material): Show that the Q23: If a "break" occurs in the population Q25: You want to determine whether or not Q26: (Requires Appendix Material) Define the difference Q28: You collect monthly data on the Q29: (Requires Appendix material) The long-run, stationary Q34: The Augmented Dickey Fuller (ADF)t-statistic
A)has a normal
Unlock this Answer For Free Now!
View this answer and more for free by performing one of the following actions

Scan the QR code to install the App and get 2 free unlocks

Unlock quizzes for free by uploading documents