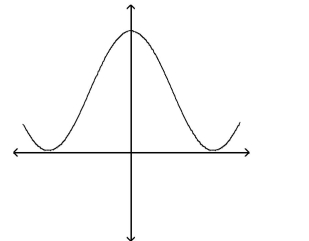
A) The graph cannot represent a normal density function because it increases as x becomes very large or very small.
B) The graph cannot represent a normal density function because it takes negative values for some values of x.
C) The graph cannot represent a normal density function because the area under the graph is greater than 1.
D) The graph can represent a normal density function.
Correct Answer:
Verified
Q1: Suppose a uniform random variable can be
Q3: The normal density curve is symmetric about
A)
Q4: The highest point on the graph
Q5: Suppose x is a uniform random variable
Q6: High temperatures in a certain city for
Q7: Suppose x is a uniform random variable
Q8: The diameter of ball bearings produced in
Q9: True or False: In a uniform probability
Q10: You are performing a study about
Q11: Compare a graph of the normal density
Unlock this Answer For Free Now!
View this answer and more for free by performing one of the following actions

Scan the QR code to install the App and get 2 free unlocks

Unlock quizzes for free by uploading documents