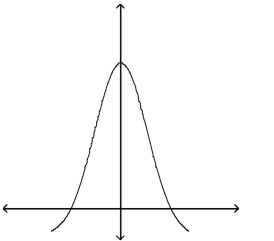
A) The graph cannot represent a normal density function because the graph takes negative values for some values of x.
B) The graph cannot represent a normal density function because the area under the graph is less than 1.
C) The graph cannot represent a normal density function because it is not symmetric.
D) The graph can represent a normal density function.
Correct Answer:
Verified
Q10: You are performing a study about
Q11: Compare a graph of the normal density
Q12: A machine is set to pump cleanser
Q13: A random number generator is set top
Q14: The graph of a normal curve
Q16: High temperatures in a certain city for
Q17: Draw a normal curve with μ =
Unlock this Answer For Free Now!
View this answer and more for free by performing one of the following actions

Scan the QR code to install the App and get 2 free unlocks

Unlock quizzes for free by uploading documents