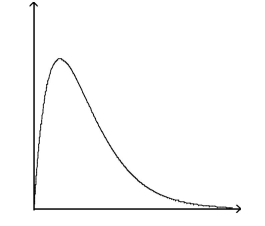
A) The graph cannot represent a normal density function because it is not symmetric.
B) The graph cannot represent a normal density function because as x increases without bound, the graph takes negative values.
C) The graph cannot represent a normal density function because it is bimodal.
D) The graph can represent a normal density function.
Correct Answer:
Verified
Q5: Find the area under the standard normal
Q6: Find the area under the standard normal
Q7: Find the area under the standard normal
Q13: Find the area under the standard normal
Q16: Find the area under the standard normal
Q19: Approximately _% of the area under the
Q20: Compare a graph of the normal density
Q21: The average mpg (miles per gallon)
Q27: Find the area under the standard normal
Q29: True or False: The area under the
Unlock this Answer For Free Now!
View this answer and more for free by performing one of the following actions

Scan the QR code to install the App and get 2 free unlocks

Unlock quizzes for free by uploading documents