The boxplot shown below was constructed in Excel for the amount of soda that was poured by a fillingmachine into 12-ounce soda cans at a local bottling company. 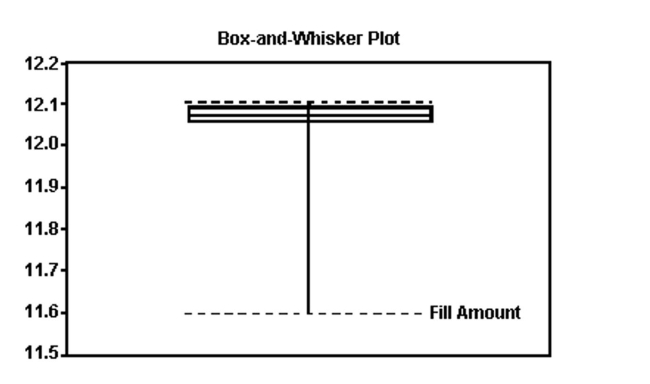 Based on the information given in the boxplot below, what shape do you believe the data to have?
A) skewed to the left
B) approximately symmetric
C) skewed to the right
D) cannot be determined
Correct Answer:
Verified
Q129: The monthly telephone usage (in minutes)
Q130: Eleven high school teachers were asked
Q131: A group of 79 students were
Q132: Given the following five-number summary, find the
Q133: A random sample of sale prices
Q135: The following is a sample of 19
Q136: The following data are the yields, in
Q137: A group of 79 students were
Q138: SAS was used to compare the high
Q139: Given the following five-number summary, find the
Unlock this Answer For Free Now!
View this answer and more for free by performing one of the following actions

Scan the QR code to install the App and get 2 free unlocks

Unlock quizzes for free by uploading documents