Use the information given in the chart or graph to determine the truth values of the simple statements. Then determine the truth value of the compound statement given.
-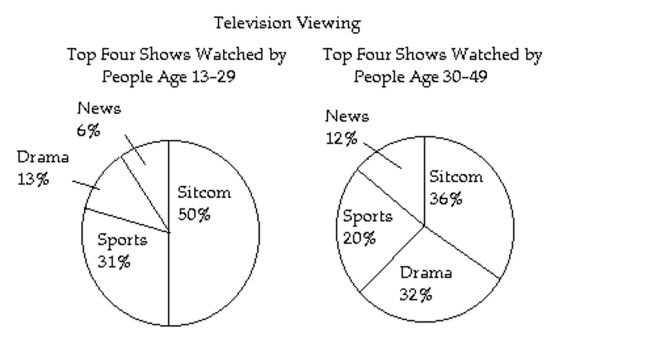
The most common type of TV show watched by 13-29 year-olds is the sitcom, or 31% of 13-29 year-olds watch sports and 20% of 30-49 year-olds watch sports.
Correct Answer:
Verified
Q154: Use DeMorganʹs laws or a truth
Q155: Use DeMorganʹs laws or a truth
Q156: Write an equivalent sentence for the statement.
-If
Q157: Use DeMorganʹs laws or a truth
Q158: Write an equivalent sentence for the statement.
-Denim
Q160: Write an equivalent sentence for the statement.
-It
Q161: Write the contrapositive of the statement.
Q162: Write the indicated statement. Use De Morgan's
Q163: Write the contrapositive of the statement. Then
Q164: Write an equivalent sentence for the statement.
-If
Unlock this Answer For Free Now!
View this answer and more for free by performing one of the following actions

Scan the QR code to install the App and get 2 free unlocks

Unlock quizzes for free by uploading documents