Solve the problem.
-Use the following graph, which shows the sales of digital music players, in millions, at a national Electronics retail store for the years 2005-2012. Use the graph to represent the set in roster form. 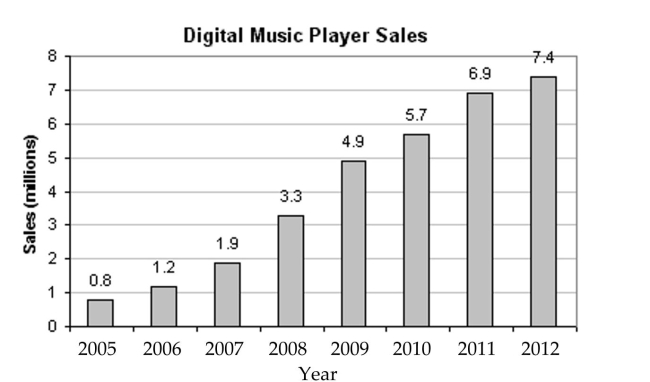
The set of years included in the graph in which digital music player sales were between 3 million And 5 million.
A) {2008, 2009}
B) {2008, 2009, 2010}
C) {2007, 2008, 2009}
D) {2009, 2010}
Correct Answer:
Verified
Q18: Determine whether the set is well defined
Q19: Identify the set as finite or
Q20: Determine whether the set is well defined
Q21: Express the set in roster form.
-{x|x is
Q22: Express the set in roster form.
-{x|x is
Q24: Write the set in set-builder notation.
-{7}
Q25: Solve the problem.
-Use the following table,
Q26: Solve the problem.
-Use the following table,
Q27: Solve the problem.
-Use the following graph which
Q28: Express the set in roster form.
-{x|x is
Unlock this Answer For Free Now!
View this answer and more for free by performing one of the following actions

Scan the QR code to install the App and get 2 free unlocks

Unlock quizzes for free by uploading documents