The graph shows the monthly revenue in millions of dollars of a growing company after the company doubled its advertising. Use the graph to solve the problem. 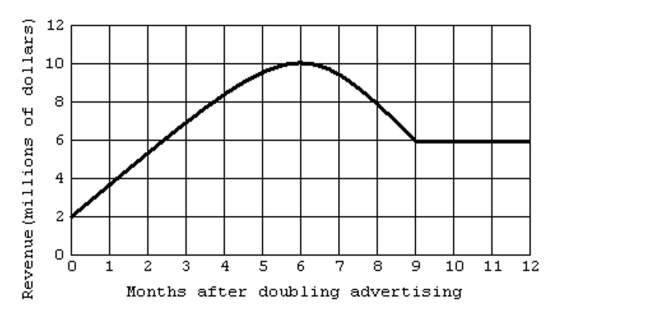
-Estimate the maximum revenue during the period of time plotted on the graph.
A) $7 million
B) $10 million
C) $9 million
D) $5 million
Correct Answer:
Verified
Q42: Solve the problem.
-A customer at a store
Q43: Graph using a graphing utility and
Q44: Use the graph to identify the x-
Q45: Use the graph to identify the x-
Q46: The graph shows the monthly revenue in
Q48: Use the graph to identify the x-
Q49: Solve the problem.
-A projectile is fired from
Q50: Write the sentence as a linear
Q51: Use the graph to identify the x-
Q52: Solve the problem.
-The linear equation in two
Unlock this Answer For Free Now!
View this answer and more for free by performing one of the following actions

Scan the QR code to install the App and get 2 free unlocks

Unlock quizzes for free by uploading documents