The pie chart below shows the number of pizzas consumed by college students in a typical month. Use the chart to
answer the question. 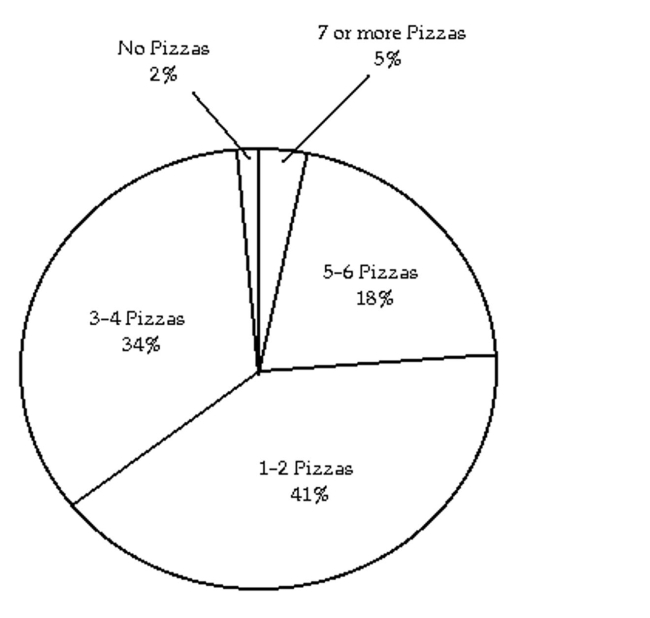
-If State University has approximately 25,000 students, about how many would you expect to consume 5-6 pizzas in a typical month?
A) 4500 students
B) 850 students
C) 8500 students
D) 450 students
Correct Answer:
Verified
Q150: Let x represent the number. Write the
Q151: Let x represent the number. Use
Q152: Let x represent the number. Use the
Q153: The pie chart below shows the number
Q154: Let x represent the number. Write
Q156: Solve the problem.
-Due to a lack of
Q157: Let x represent the number. Use
Q158: Let x represent the number. Write
Q159: Let x represent the number. Use the
Q160: Let x represent the number. Use the
Unlock this Answer For Free Now!
View this answer and more for free by performing one of the following actions

Scan the QR code to install the App and get 2 free unlocks

Unlock quizzes for free by uploading documents