Monthly closing stock prices for a utility company were obtained from January 2007
through August 2008. A regression model was estimated to describe the trend in closing
stock prices over time.
a. Based on the plot of residuals versus predicted values, is the linear model
appropriate? Explain.
b. The Durbin-Watson statistic for this regression was found to be 0.5626. What can you
conclude from this statistic? 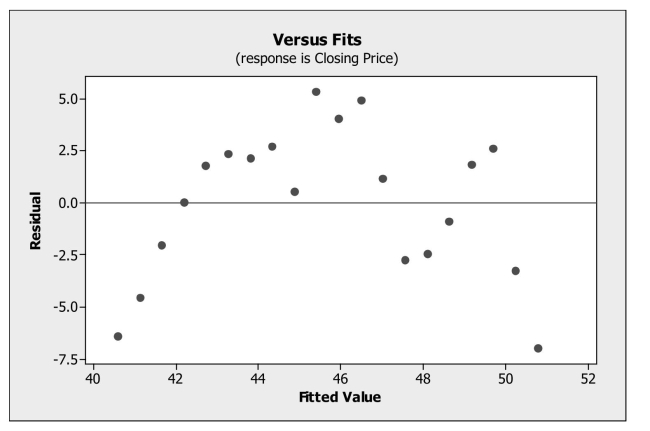
Correct Answer:
Verified
View Answer
Unlock this answer now
Get Access to more Verified Answers free of charge
Q6: Examining residuals for groups.
-A medical researcher was
Q7: Examining residuals for groups.
-A medical researcher was
Q8: Perform statistical inference for multiple regression.
-The advertising
Q9: Recognize the presence of autocorrelation in residuals.
-Quarterly
Q10: Re-express data to make them appropriate for
Q12: Recognize an extrapolation.
-Data on internet usage (per
Q13: Data on labor productivity and unit labor
Q14: A regression model was developed relating average
Q15: Data on internet usage (per 100 inhabitants)
Q16: Recognize the presence of autocorrelation in residuals.
-Monthly
Unlock this Answer For Free Now!
View this answer and more for free by performing one of the following actions

Scan the QR code to install the App and get 2 free unlocks

Unlock quizzes for free by uploading documents