Solve the problem.
-You brake your car from a speed of 60 mph. The table shows data that represent your car's speed versus the amount of time elapsed from the moment that you began to brake. 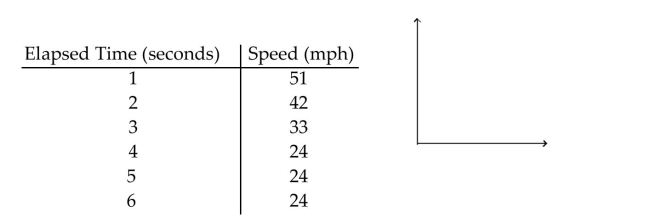 Graph the data. For what interval of time is the speed increasing? For what interval of time is the speed Decreasing? For what interval of time is the speed constant?
A) 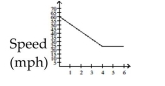
Elapsed Time (seconds)
0 to 4 seconds; None; 4 to 6 seconds
B) 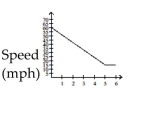
Elapsed Time (seconds)
0 to 5 seconds; None; 5 to 6 seconds
C) 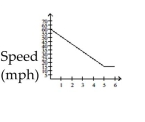
Elapsed Time (seconds)
None; 0 to 5 seconds; 5 to 6 seconds
D) 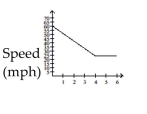
Elapsed Time (seconds)
None; 0 to 4 seconds; 4 to 6 seconds
Correct Answer:
Verified
Q120: Find or investigate the function as requested.
-The
Q121: Find or investigate the function as
Q122: Solve the problem.
-John is paid a weekly
Q123: Find or investigate the function as
Q124: Solve the problem.
-The town of Appleville recorded
Q126: Find or investigate the function as requested.
-Find
Q127: Find or investigate the function as requested.
-Find
Q128: Solve the problem.
-For its regular delivery
Q129: Solve the problem.
-Crafty Bill's Cool Car Sales
Q130: Solve the problem.
-The level of water in
Unlock this Answer For Free Now!
View this answer and more for free by performing one of the following actions

Scan the QR code to install the App and get 2 free unlocks

Unlock quizzes for free by uploading documents