Construct the requested statistical display.
-The mileage ratings for city driving of various subcompact cars are listed below. Construct a line plot using the data.
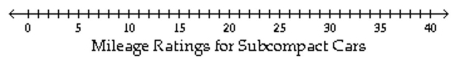
A) 
B) 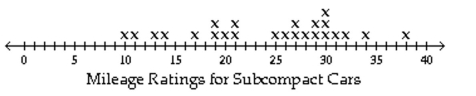
C) 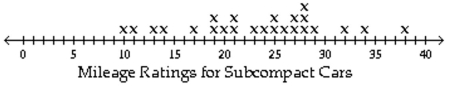
D) 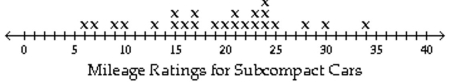
Correct Answer:
Verified
Q7: Use the figure to answer the
Q8: Use the figure to answer the
Q9: Use the statistical display to answer the
Q10: Use the statistical display to answer the
Q11: Use the statistical display to answer the
Q13: Use the statistical display to answer
Q14: Construct the requested statistical display.
-The attendance
Q15: Use the figure to answer the question.
-The
Q16: Use the statistical display to answer the
Q17: Use the figure to answer the question.
-The
Unlock this Answer For Free Now!
View this answer and more for free by performing one of the following actions

Scan the QR code to install the App and get 2 free unlocks

Unlock quizzes for free by uploading documents