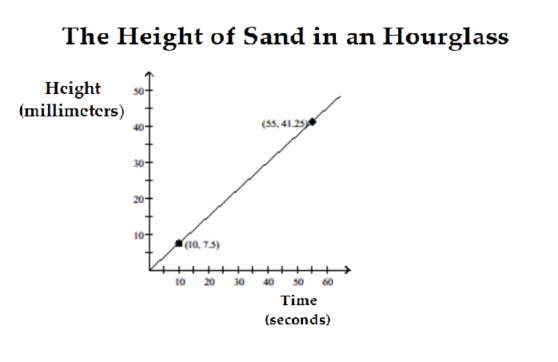
The graph below shows the height of sand in an hourglass at various times. Use the graph to find the average rate of change of the height of the sand.
A) per second
B) per second
C) per second
D) per second
Correct Answer:
Verified
Q126: Find the average rate of change.
Q127: Find the average rate of change.
Q128: Find the slope-intercept form of the
Q129: Find the slope-intercept form of the
Q130: Find the average rate of change.
Q132: Find the slope-intercept form of the
Q133: Find the slope-intercept form of the
Q134: Choose one of the four lines graphed
Q135: Choose one of the four lines
Q136: Choose one of the four lines graphed
Unlock this Answer For Free Now!
View this answer and more for free by performing one of the following actions

Scan the QR code to install the App and get 2 free unlocks

Unlock quizzes for free by uploading documents