Solve the problem.
-Sixteen workers were surveyed about how long it takes them to travel to work each day. The data below are given in minutes. Represent the data in a double-stem display.
A) 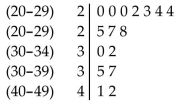
B) 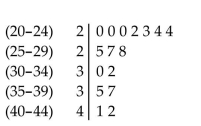
C) 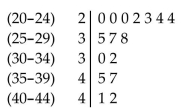
D) 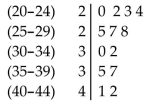
Correct Answer:
Verified
Q68: Use the graph to answer the question.
-
Q69: Find the indicated probability.
-A relative frequency
Q70: Find the indicated probability.
-The table shows the
Q71: Use the graph to answer the question.
-
Q72: Use the graph to answer the question.
-
Q74: Use the information to complete a
Q75: Find the indicated probability.
-The age distribution
Q76: Use the graph to answer the question.
-
Q77: Use the graph to answer the question.
-
Q78: Make a bar graph to represent
Unlock this Answer For Free Now!
View this answer and more for free by performing one of the following actions

Scan the QR code to install the App and get 2 free unlocks

Unlock quizzes for free by uploading documents