Solve the problem.
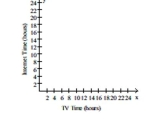
-The table below shows the times (in hours) that seven students spend watching television and using the internet. Construct a scatter diagram for the data and state whether these times have no correlation, a positive correlation, or a negative correlation.
A) Negative correlation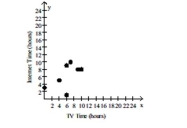
B) Positive correlation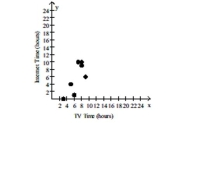
C) No correlation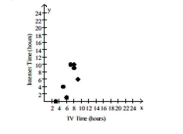
D) Positive correlation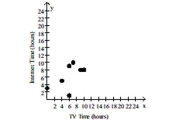
Correct Answer:
Verified
Q1: Select the best estimate of the correlation
Q2: State whether you believe the two variables
Q3: State whether there is no correlation, a
Q4: Select the best estimate of the correlation
Q6: State whether there is no correlation, a
Q7: State whether you believe the two variables
Q8: State whether you believe the two variables
Q9: Solve the problem.
-The table below shows
Q10: State whether you believe the two variables
Q11: Select the best estimate of the correlation
Unlock this Answer For Free Now!
View this answer and more for free by performing one of the following actions

Scan the QR code to install the App and get 2 free unlocks

Unlock quizzes for free by uploading documents