The histogram shows the waiting times for a new roller coaster at a theme park for a sample of 1000 riders throughout the first week of operation. Over the histogram, draw a smooth curve that captures its general features. Then classify the distribution according to its number of modes and its symmetry or skewness. In words, summarize the meaning of your results. 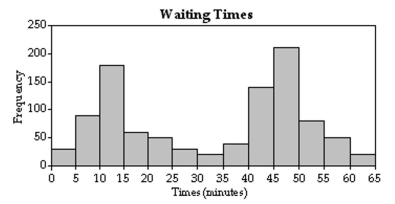
Correct Answer:
Verified
View Answer
Unlock this answer now
Get Access to more Verified Answers free of charge
Q2: Provide an appropriate response.
-The mean of a
Q7: Dave is a college student contemplating a
Q18: Suppose that a state introduces a state
Q32: Does the mode of a data set
Q44: Explain how two data sets could have
Q45: A teacher has a morning class with
Q46: A food inspector finds that 6% of
Q48: State how many modes you would expect
Q54: State how many modes you would expect
Q55: The histogram shows the weights (in grams)of
Unlock this Answer For Free Now!
View this answer and more for free by performing one of the following actions

Scan the QR code to install the App and get 2 free unlocks

Unlock quizzes for free by uploading documents