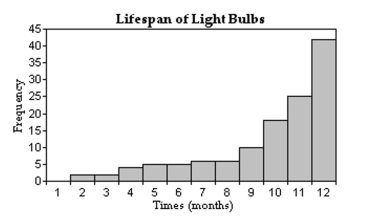
The histogram shows the lifespan of a sample of 125 light bulbs. Over the histogram, draw a smooth curve that captures its general features. Then classify the distribution according to its number of modes and its symmetry or skewness. In words, summarize the meaning of your results.
Correct Answer:
Verified
View Answer
Unlock this answer now
Get Access to more Verified Answers free of charge
Q2: Provide an appropriate response.
-The mean of a
Q7: Dave is a college student contemplating a
Q39: Find the mode(s)for the given sample data.
-7.34,
Q40: The host of a dinner party purchases
Q41: State how many modes you would expect
Q42: State how many modes you would expect
Q43: State how many modes you would expect
Q45: A teacher has a morning class with
Q46: A food inspector finds that 6% of
Q48: State how many modes you would expect
Unlock this Answer For Free Now!
View this answer and more for free by performing one of the following actions

Scan the QR code to install the App and get 2 free unlocks

Unlock quizzes for free by uploading documents